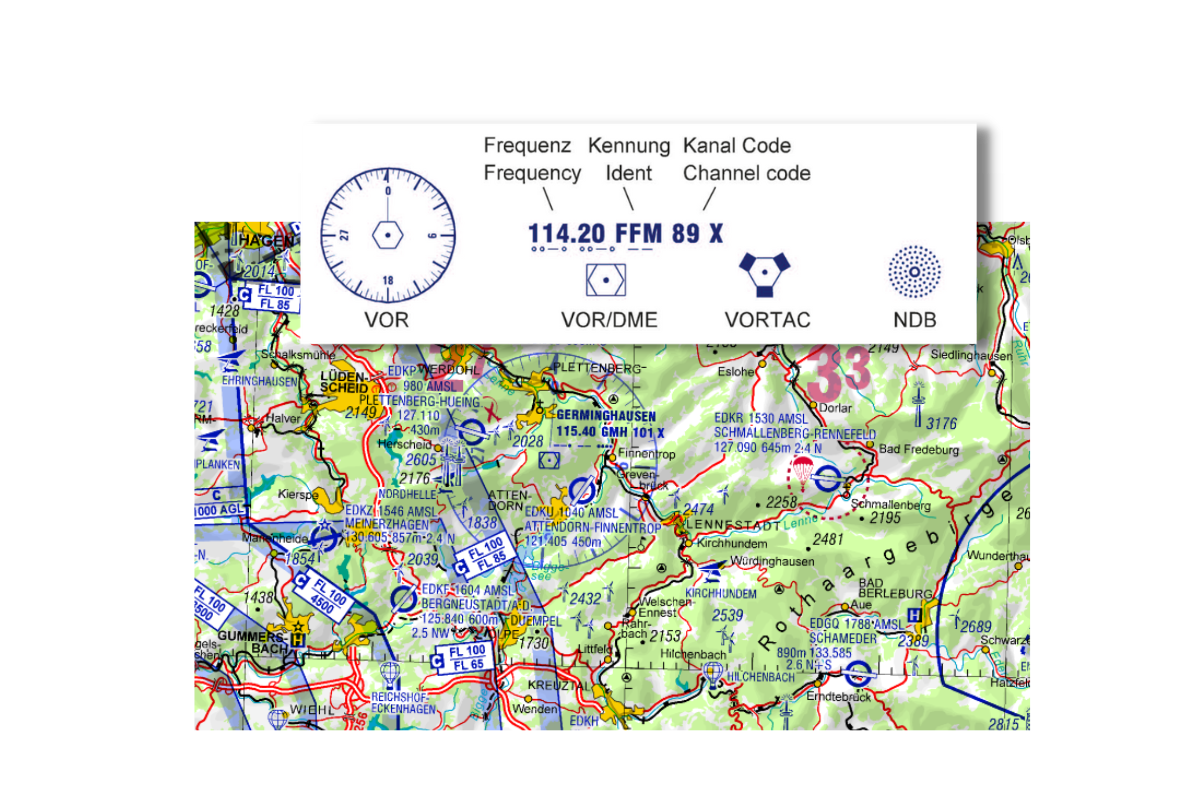
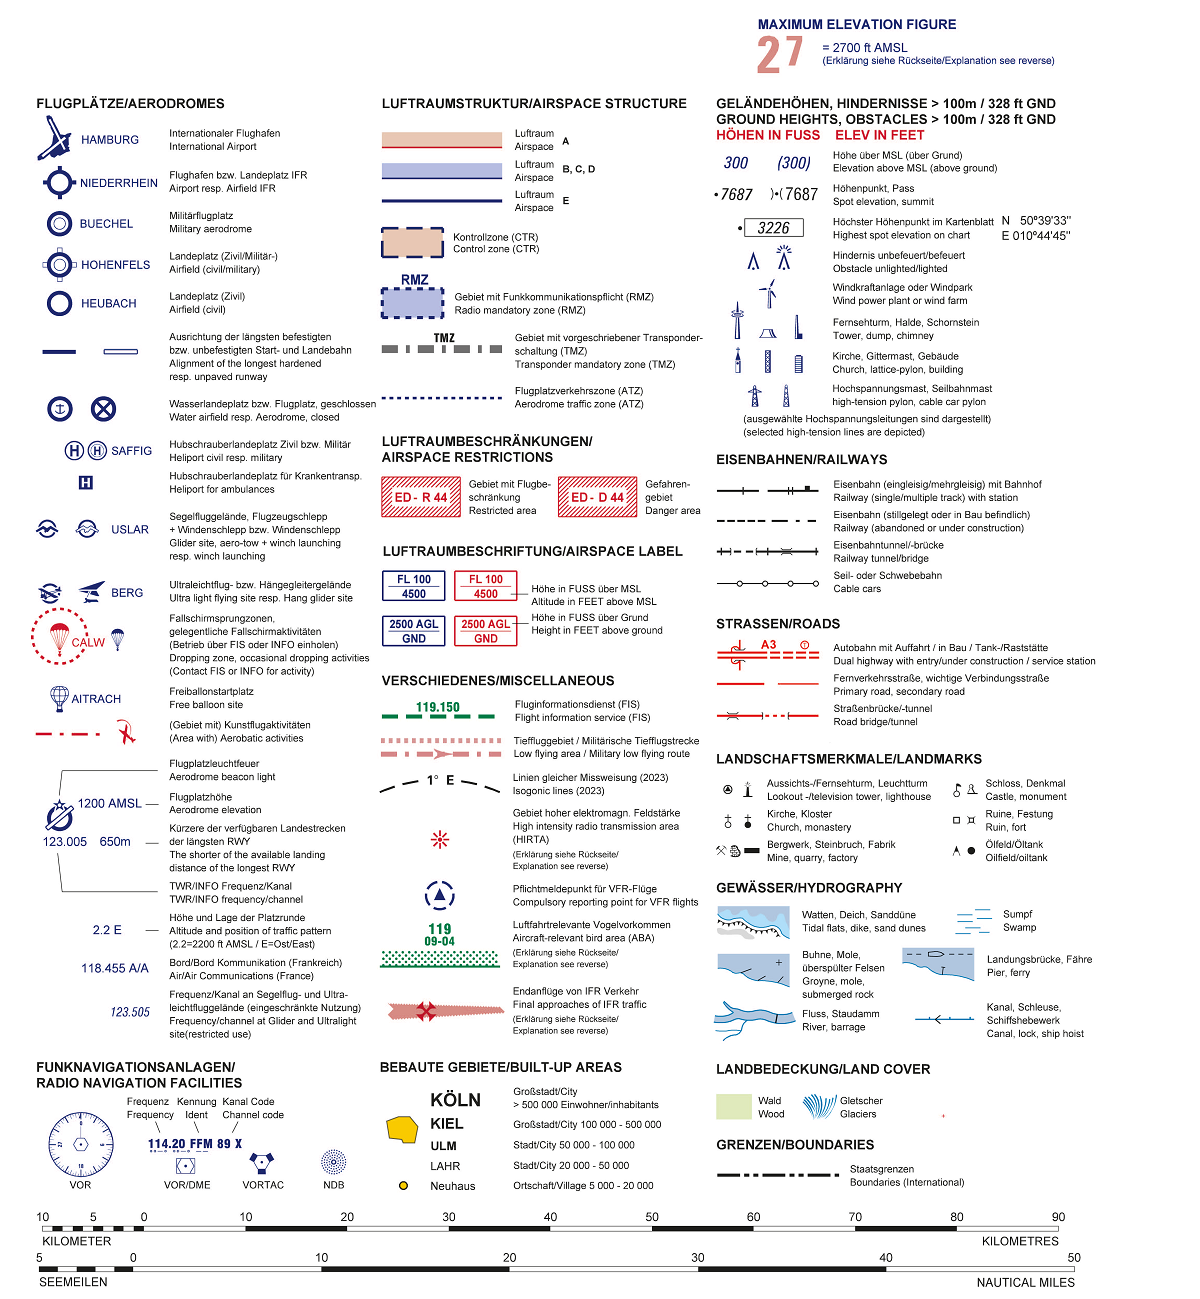
Radio navigation facilities
FRadio navigation facilities, which can be used as a means of navigation, are also shown on the ICAO chart. We distinguish between the VOR (in German: UKW-Drehfunkfeuer) and the VOR-DME. If the aircraft is equipped with a DME, the oblique distance is transmitted to us in addition to the VOR function. DME stands for Distance Measuring Equipment. The VOR-DME symbol differs from the VOR symbol only by the additional rectangle.
The Vortac can be used for civilian use as VOR/DME and for military use as TACAN. TACAN stands for Tactical Air Navigation. Last but not least, there is the non-directional radio beacon, the NDB.
For all radio navigation beacons you will find: The frequency to be used for civil use of the respective beacon, the identifier, the radiated identifier as Morse code as well as the channel frequency for military use.